
FxGrow is excited to inform you that we have updated our economic calendar with a new interactive version. This version is more interactive and more detailed. Please check below how to read and anticipate data before and after the release from left to right. You have the choice either to choose recent and next economic news, today's full economic news, tomorrow's economic news, weekly economic news, and also next week if you are looking for expanding your research. Also, if you click on filters, you can choose countries that you wish to see their economic release depending on your trading instruments.
Please check below instruments available on economic calendar with visual and a brief elaboration on how to read and anticipate EC.
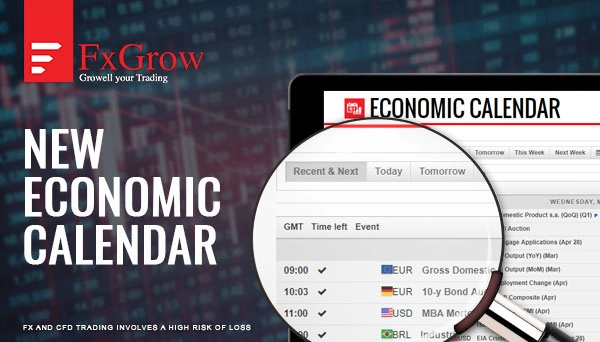
1- First of all, it's all about timing being prepared before and after the economic news is released. GMT, is a united timing set as Greenwich Mean Time set as United Kingdom timing. You can check your time zone and how many hours it's different from UK, depending on your country Latitudes

2- Time left indicates how many hours, minutes and seconds left to the data release.
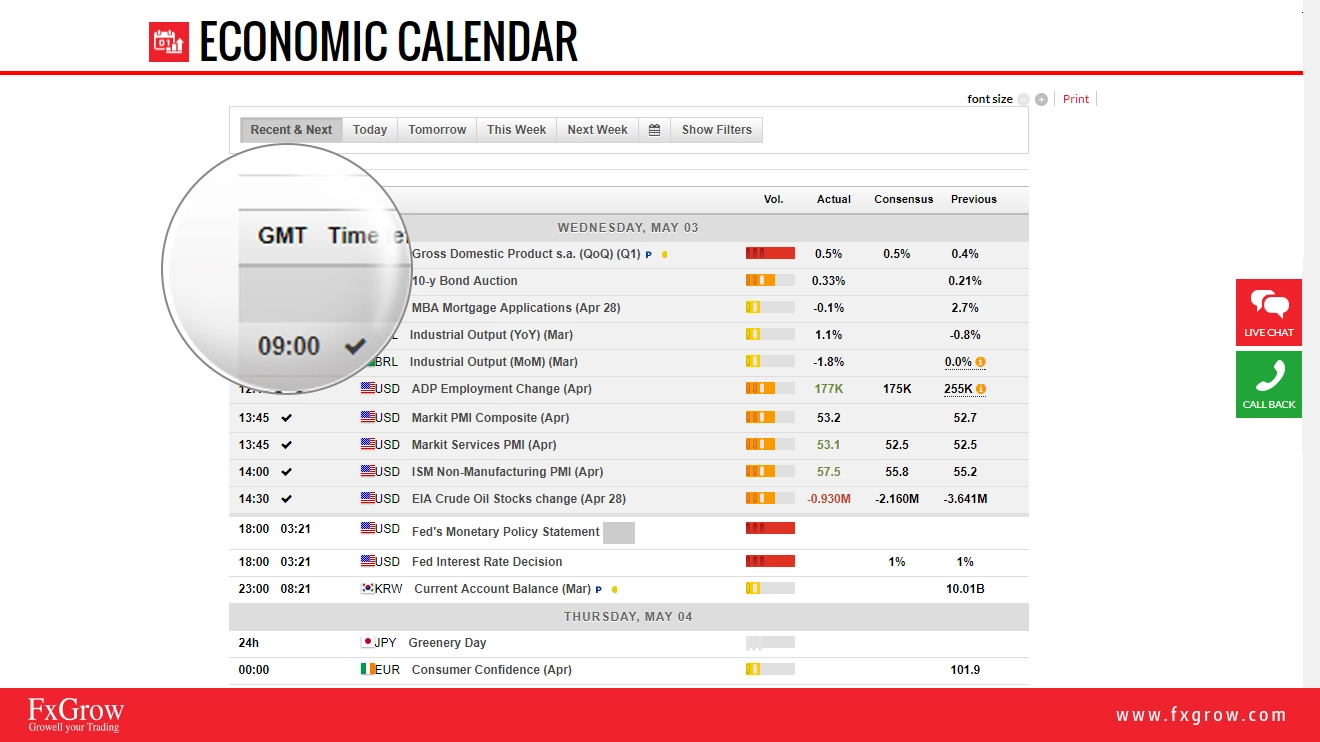
3- Event, is the title of the economic data or news that was and about to be released.
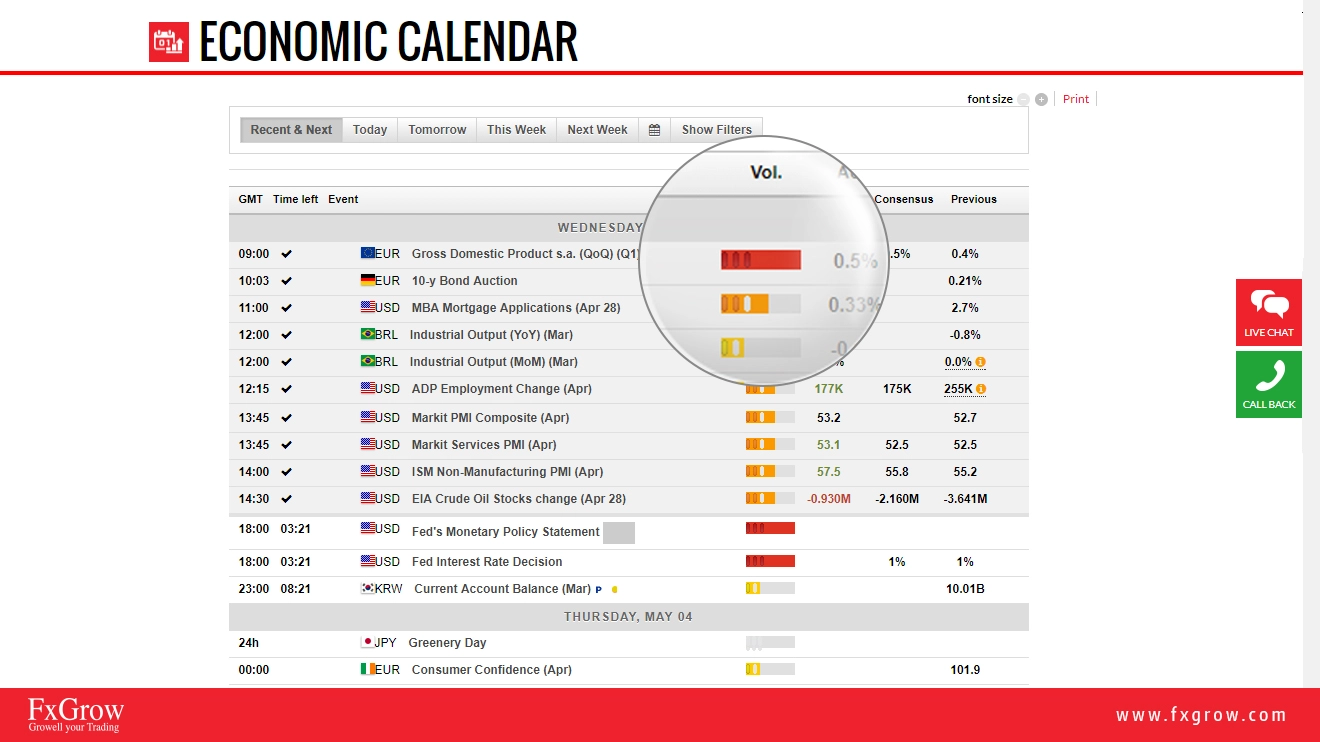
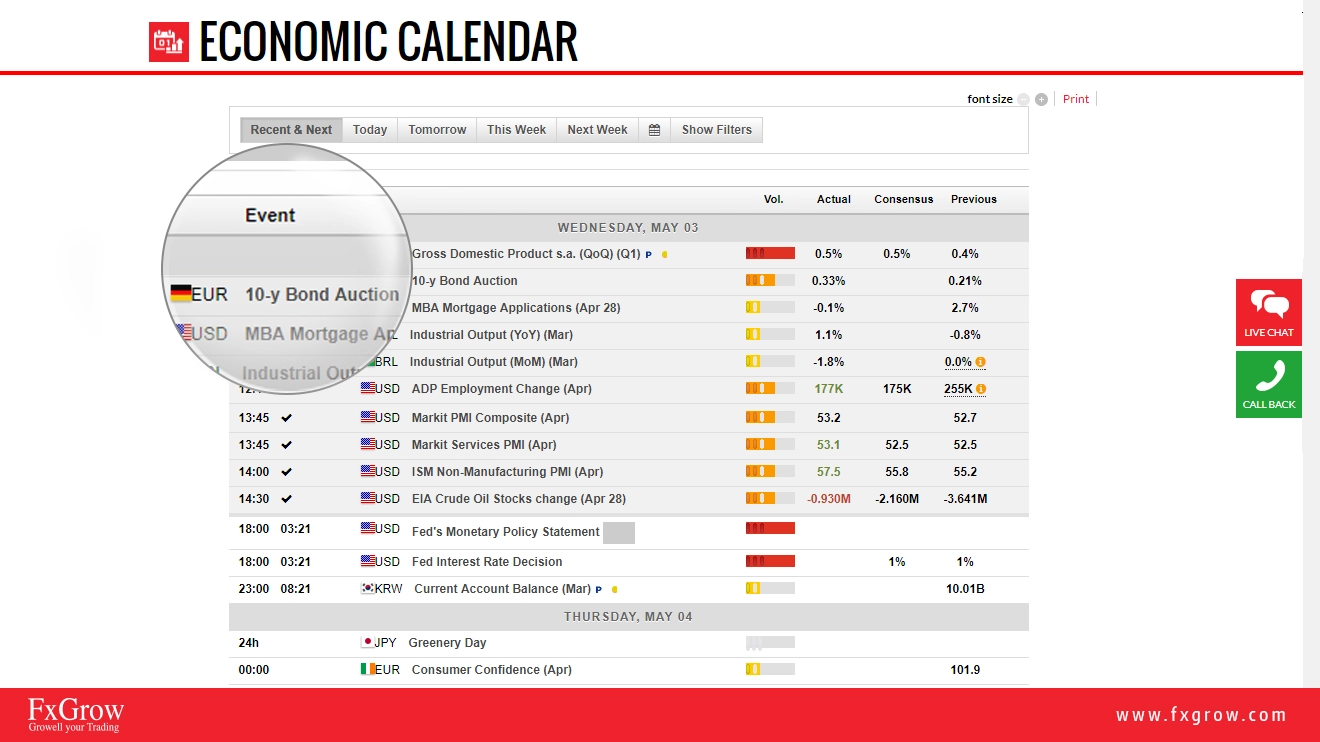
4- Vol. indicates the level or impact or degree of importance. A red color indicates a high level of impact of the currency, an orange signifies a medium impact, and yellow indicates the lowest level of importance.
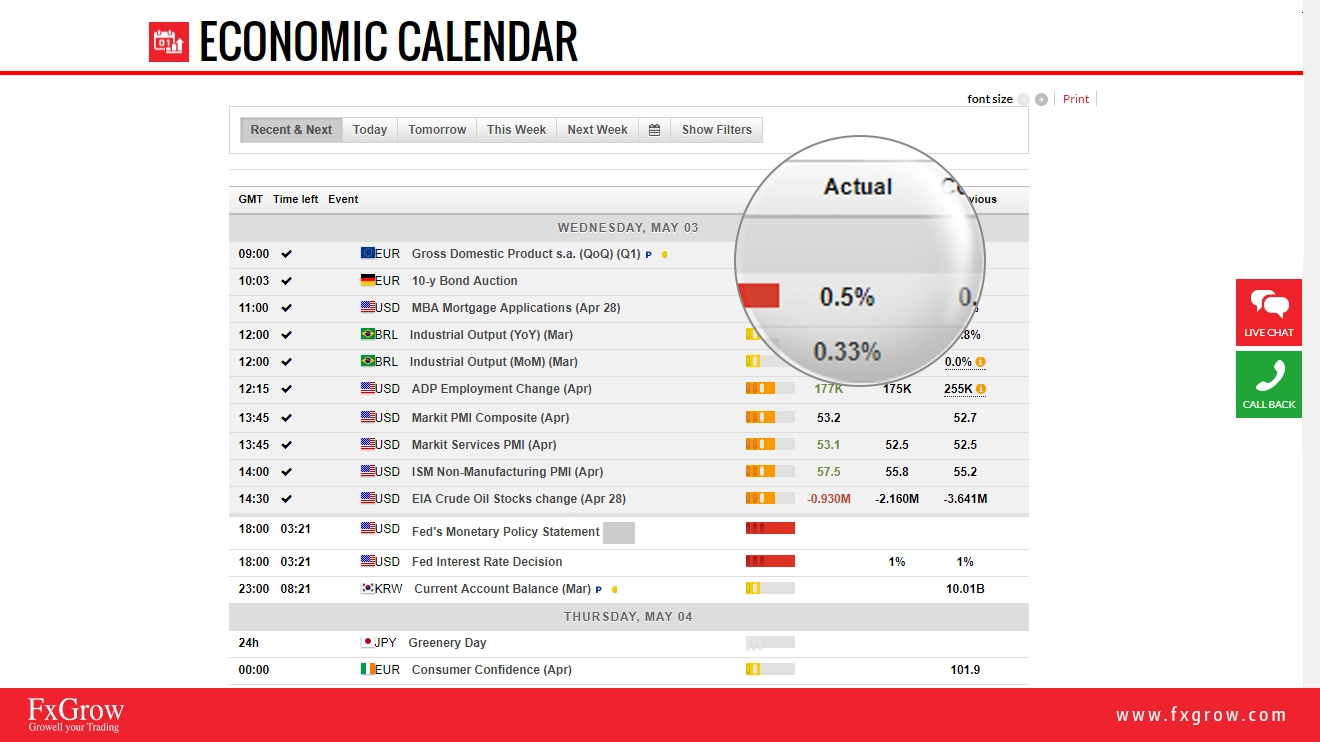
5- Actual: It is the result of the published news that is about to be released for today. It is the real and true data released by the country.
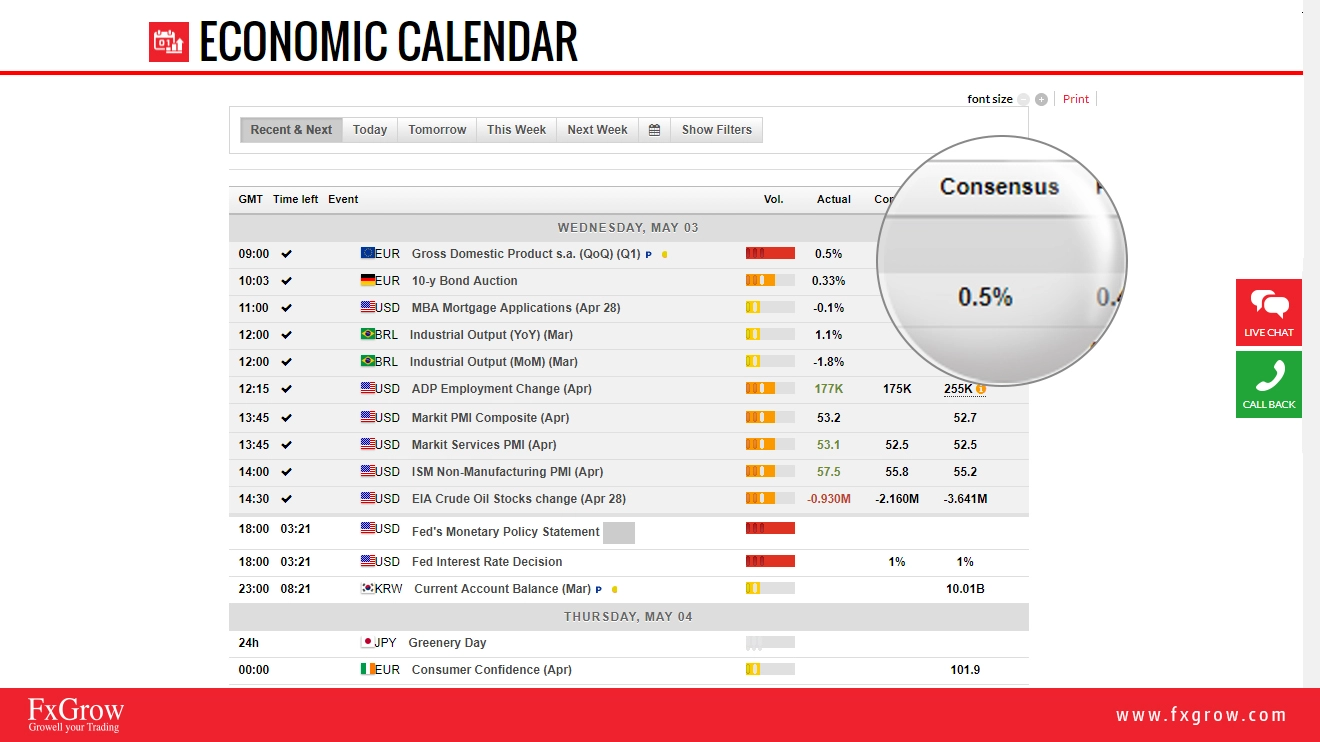
6- Consensus: It means the forecasts for possible outcome of the economic data. As the word forecasts means, the data mentioned is an expectation or possible outcomes, the expected data is not accurate and the data about to be released can either be lower, higher, or the same result.
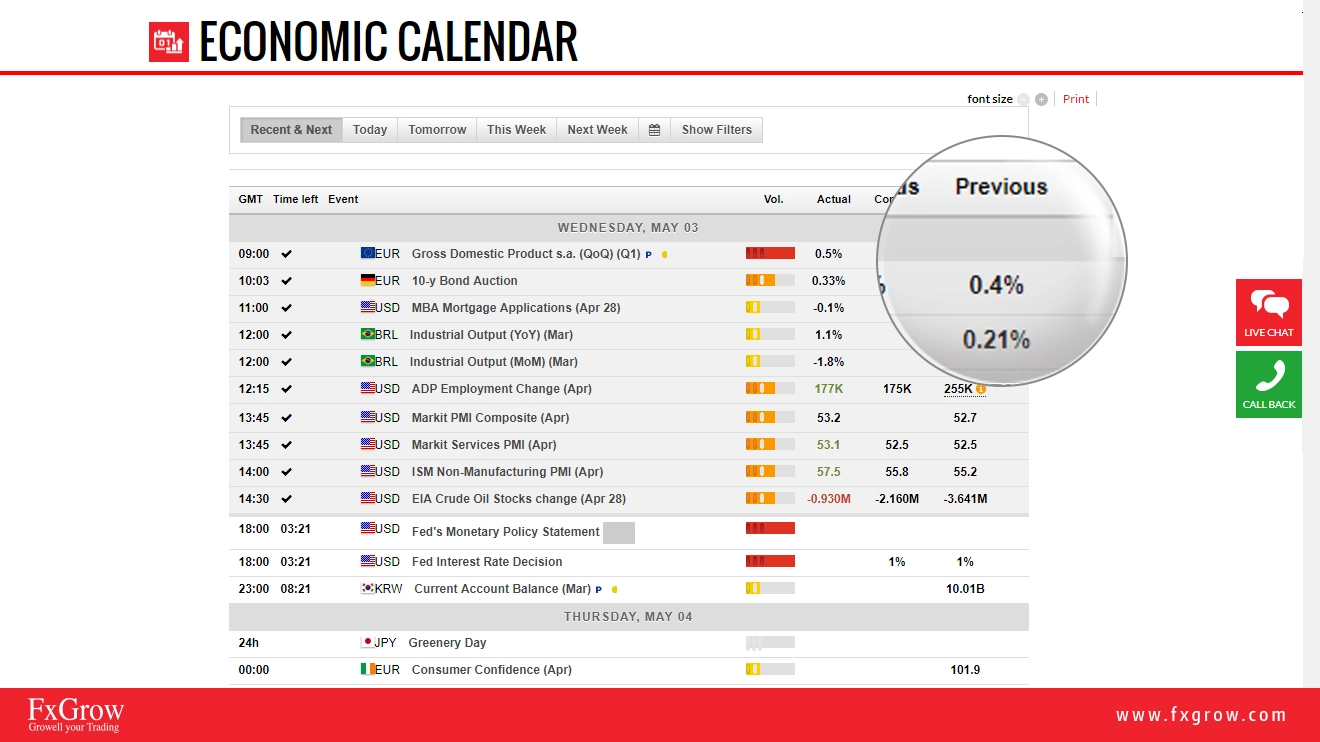
7- Previous: It's an indication of the last economic data released.
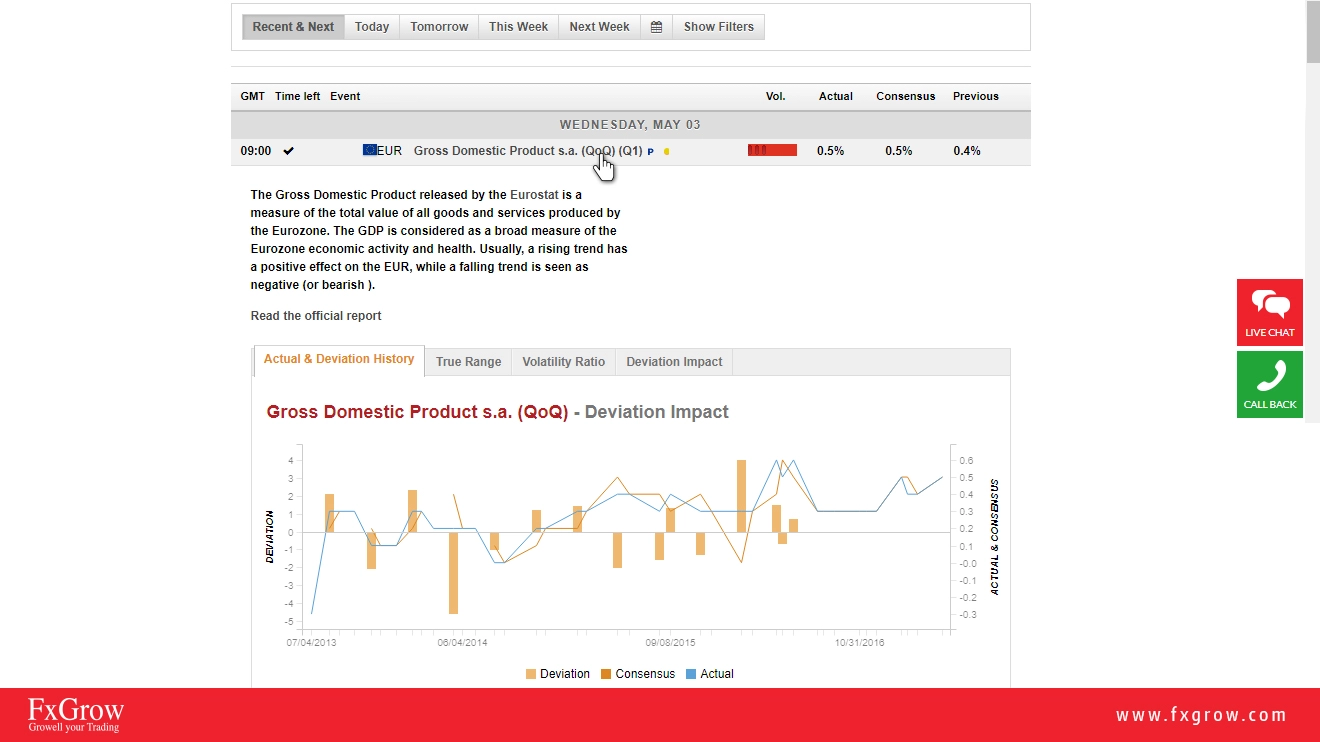
8- Also, now you have the option to read deeper analysis about the news itself, just by clicking on the news, a small paragraph will appear with details mentioned with details about its previous impact, volatility, true range, and deviation. This is meant for deeper, wider view for the event.
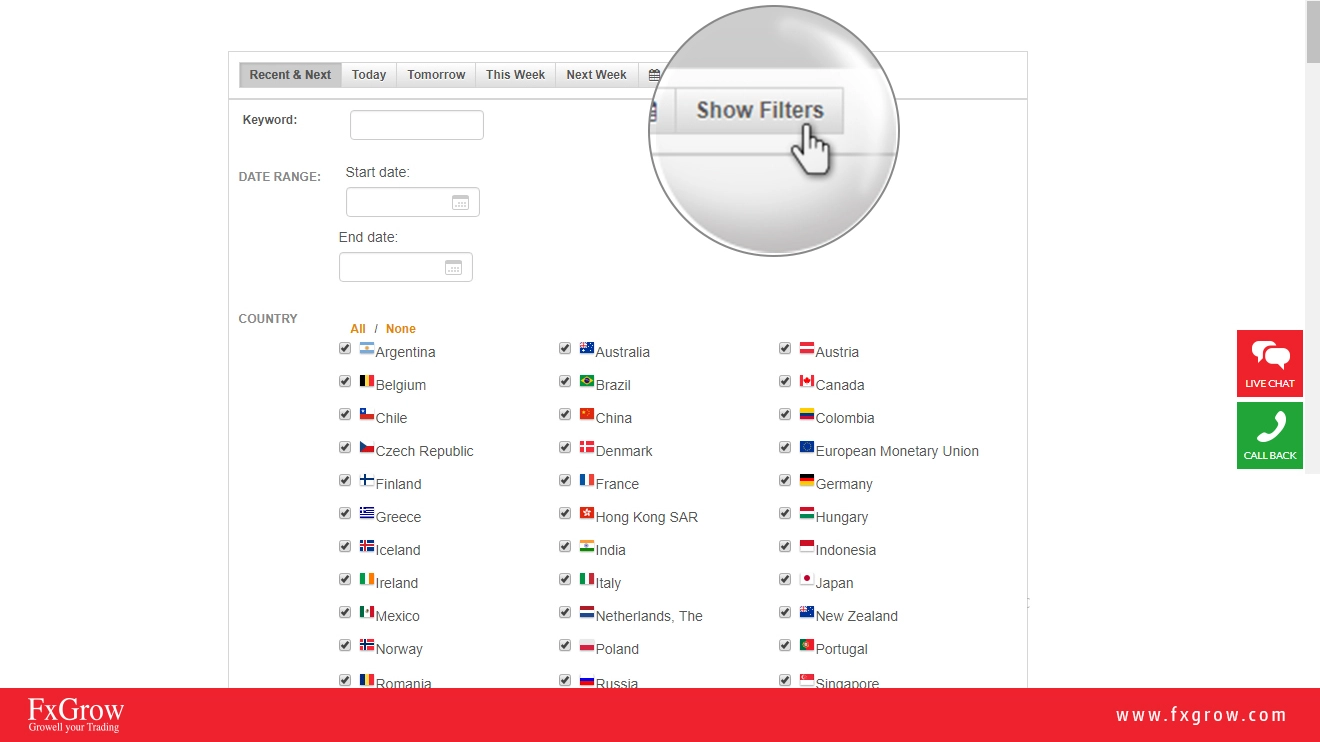
9- Also, part of providing all global economic and financial events, FxGrow added the filter option where you, as a trader, now you can choose the countries that you wish to stay updated with their economic data and latest released news. This is intended to minimize and maximize economic data input.
10 - After you have checked the above details, the final part is how to read and trade upon data released.
A green Color = Good for Currency - Actual or consensus> Forecast
A red color = Bad for Currency – Actual or Consensus < Forecast.