Analysis Types

Technical Analysis
A good understanding of the basic tenets of technical analysis can vastly improve one's'trading skills. Price Charts and Technical indicators are mathematical representations of market patterns and behaviors. Here are descriptions of some of the more widely used and time tested studies that technicians keep in their toolboxes:
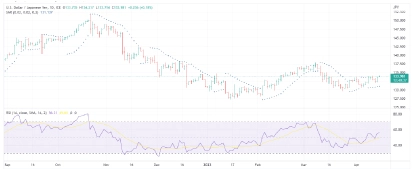
Stochastics
Stochastics are measured and represented by two different lines, %K and %D and are plotted on a scale ranging from 0 to 100. Indications above 80 represent strong upward movement (this is an overbought situation), while level indications below 20 represent strong downward movements (this is an oversold situation).
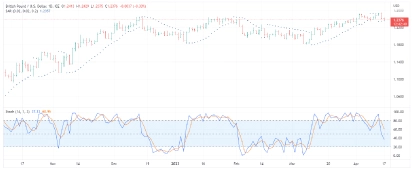
Relative Strength index (RSI)
RSI measures the momentum of price movements. It is also plotted on a scale ranging from 0 to 100. Traders will tend to look at RSI readings over 80 as an indicator of a market that is overbought or susceptible to a downturn, and readings under 20 as a market that is oversold or ready to turn higher.
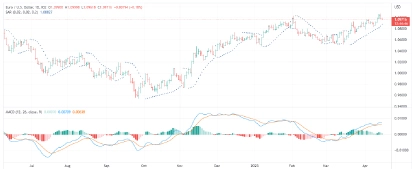
MACD - Moving Average Convergence Divergence
MACD is a more detailed method of using moving averages to find trading signals from price charts. Developed by Gerald Appel, the MACD plots the difference between a 26 day exponential moving average and a 12 day exponential moving average. A 9 day moving average is usually used as a trigger line, meaning when the MACD crosses below this trigger it is a bearish signal and when it crosses above it, it's a bullish signal.
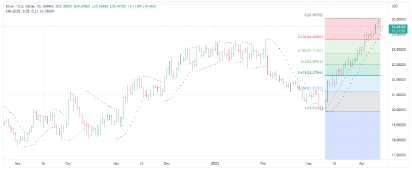
Fibonacci Retracements
Fibonacci retracement levels are a sequence of numbers discovered by the noted mathematician Leonardo da Pisa during the twelfth century. These numbers describe cycles found throughout nature and when applied to technical analysis can be used to find pullbacks in the currency market.